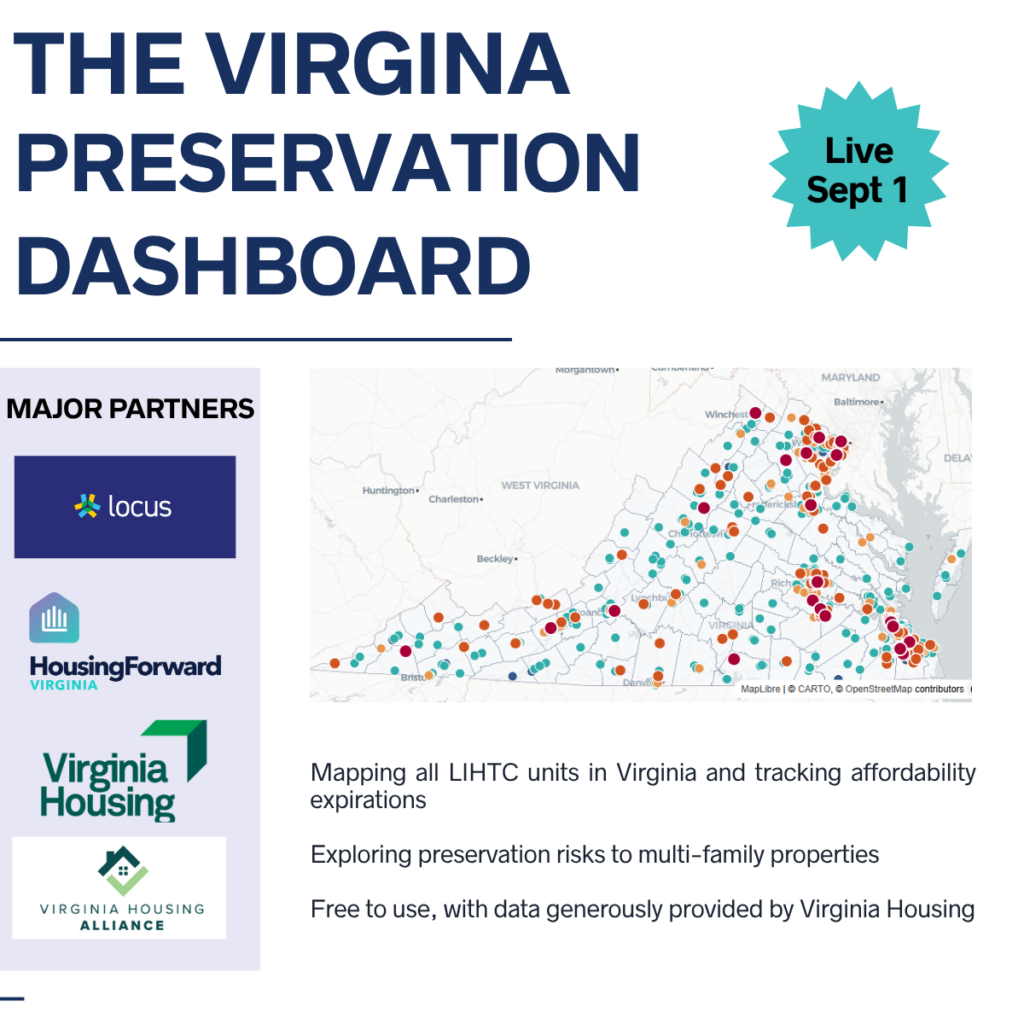
Our new interactive tool maps every LIHTC property in the Commonwealth and flags which ones are at risk of losing their affordability restrictions.
We’re excited to announce that the Virginia Affordable Housing Preservation Dashboard is now public.
Every year, income-restricted apartments across Virginia reach the end of their affordability period — the point at which a property financed through the Low-Income Housing Tax Credit (LIHTC) program can convert to market-rate rents. Losing those units quietly, one expiring restriction at a time, is one of the biggest threats to the affordable housing stock we already have. Until now, tracking which properties were at risk — and when — meant piecing together data from a handful of different sources.
The dashboard puts it all in one place. Use it to map LIHTC properties across the state, track expiring affordability restrictions, and explore other preservation risks to multifamily housing. It’s built to give advocates, practitioners, and elected officials a clearer picture of which affordable rental properties are most at risk of losing their affordability restrictions — and where preservation efforts may be most urgent across the Commonwealth.
For those who need a reminder of what LIHTC is and how it fits into the affordable housing landscape, check out our Back to Basics explainer on the program.
WHY IT MATTERS
Preserving affordable housing is as important as building it. When affordability restrictions expire and properties exit the LIHTC program, those units are effectively lost — often converting to market-rate rents that are out of reach for the households they once served. New production alone cannot keep pace if the existing affordable stock continues to erode.
Preservation closes that gap. Keeping a unit affordable is typically faster and less costly than building a new one, and it protects communities and residents from displacement in the process. A balanced approach that pairs new production with active preservation is the only way to grow the net supply of affordable housing, rather than simply replace what’s lost.
For more information on the scale of this risk and the preservation vs. production cost case:
- NLIHC / PAHRC report via Housing Finance: Nearly 500,000 LIHTC Units at Risk of Being Lost
- Urban Institute: Preserving Affordable Housing: What Works
What the dashboard shows
The dashboard captures over 1,000 properties that are in their 30-year affordability period, representing over 100,000 discrete units (rural, suburban, and urban) that have been subsidized through federal tax credits. Every property is a clickable point — click it and you get the full picture: property name, location, ownership type, unit count, LIHTC award history, and an expiration date.
These features make it more than just a map:
Filter by what matters to you. Narrow the view by expiration window, ownership type, building class, city, or property size. The map updates in real time.
See risk at a glance. Points are color-coded by urgency. Red shows properties expiring by 2025, while orange through green are used as timelines extend. A risk score aggregates the factors most likely to predict whether a property converts to market rate, informed by research and discussion within the coalition.
Dig into the data. A sortable property table sits alongside the map, so you can move between a geographic view and a detailed list without losing your filters.
The goal is a tool that works for an advocate scanning a region, a practitioner evaluating a specific deal, and a policymaker looking for the statewide picture — all at once. The data currently draws on Virginia Housing’s LIHTC data, enriched with CoStar building quality information and U.S. Census market data.

The risk assessment in this tool applies a consistent set of factors — drawn from research on what drives market-rate conversion — so that advocates, practitioners, and policymakers across the state are working from the same baseline. Local conditions always matter, and the score is a starting point for that conversation, not a substitute for it.
Built on Partnership
This dashboard is the product of a growing coalition of Virginia organizations invested in keeping affordable homes affordable. We designed and built the tool, drawing on data generously provided by Virginia Housing, along with support from the Virginia Housing Alliance, Locus, Capital One, and the Affordable Housing Preservation Coalition.
How to use this tool
The dashboard offers multiple ways to explore the data:
- Geographic analysis: View all LIHTC properties across Virginia as a color-coded, filterable map. Points are sized and colored to surface urgency at a glance, and clicking any property reveals its full profile.
- Summary statistics: See total properties, total units, and units expiring by a given year — all updating in real time as filters are applied.
- Risk assessment: See how each property scores across key risk factors — building quality, age, ownership type, and market pressure — that research associates with market-rate conversion.
- Property data table: Browse a sortable, searchable table of all properties in the current filtered view, with key fields including unit count, LIHTC award history, expiration date, and years remaining. Each property is also linked to market and rental conditions in its surrounding census tract, providing context for the pressure it faces.
- Ownership breakdown: Distinguish between nonprofit and for-profit ownership across the portfolio, a key factor in assessing long-term affordability risk.
What’s next
We’ll continue expanding the dashboard’s capabilities in the coming weeks and months. While this first phase tracks LIHTC properties only, future phases could incorporate additional subsidies and awards that enlarge the picture of affordable housing restrictions in place, supporting a more nuanced risk assessment.
Take action
After your first dive into the dashboard, we recommend:
- Sharing with colleagues: Help spread awareness of this resource to other partners, practitioners, and advocates who need this data.
- Sending feedback: Have questions, notice a glitch, or want to share an idea for this tool? Send an email to maria@housingforwardva.org.
- Supporting this work: If you would like to support HFV and VHA’s efforts on preservation insights, contact Isabel McLain imclain@vahousingalliance.org.