
TWD #248 • 1128 words
Understanding the differences between rural and urban Virginia communities is crucial for housing policy—but standard census data doesn’t always tell the whole story.
When we talk about housing challenges in Virginia, the conversation often splits into two camps: urban issues and rural issues. But what if the data we’re using to understand these differences isn’t granular enough—or worse, what if the geographic boundaries themselves are making it harder to see what’s really happening on the ground?
Enter the Public Use Microdata Sample, or PUMS—a powerful but underutilized tool that can help us understand the nuanced differences between urban and rural housing needs across the Commonwealth. But to use it effectively, we need to understand both its strengths and its geographic quirks.
What Makes PUMS Different?
The American Community Survey (ACS) is arguably the most important dataset produced by the Census Bureau each year. There’s a good chance you’re already familiar with ACS estimates in their published table form. For example, see DP05 (selected demographic and housing estimates), or B25031 (median gross rent by number of bedrooms).
These tables are useful, but they have limitations. They can’t answer questions like: “What percentage of rural renters in Virginia are cost-burdened and have children under 5?” or “How do homeownership rates differ between urban and rural seniors living alone?”
PUMS data works differently. Instead of pre-calculated totals, you get anonymized individual records for a subsample of all ACS responses. Think of it like the difference between getting a restaurant’s aggregated Yelp score versus reading every individual review. Both are useful, but one gives you much richer detail for understanding specific patterns and stories.
The Geography Challenge: PUMAs Aren’t Perfect
Here’s where things get interesting—and complicated. PUMS data doesn’t identify specific addresses, towns, or even counties. (That would violate privacy protections.) Instead, it uses Public Use Microdata Areas, or PUMAs. These geographies are assembled from contiguous census tracts and (with few exemptions) have populations between 100,000 and 200,000.
This target is necessary to balance privacy needs with the actual utility of the data. Unfortunately, it creates some real analytical challenges. Among Virginia’s 133 counties and cities, just seven have population totals within that range. As a result, many PUMAs take shapes you’ve never seen on a map before.
If you’re PUMA-curious, here are some things to keep in mind:
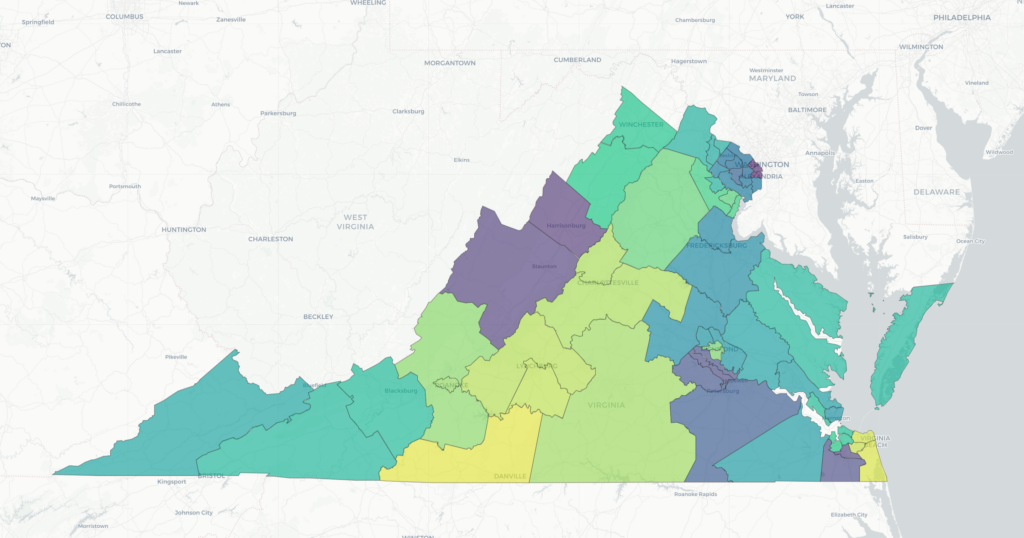
Size matters—and smaller is better. Large PUMAs tell you less about the immediate community of an individual than smaller PUMAs. See the two examples below. On the left, the Middle Peninsula, Northern Neck & Accomack-Northampton Planning District Commissions PUMA; on the right, Virginia Beach City (North) PUMA. The former has over ten separate counties, while the latter is just one of three PUMAs for Virginia Beach alone. Population density matters

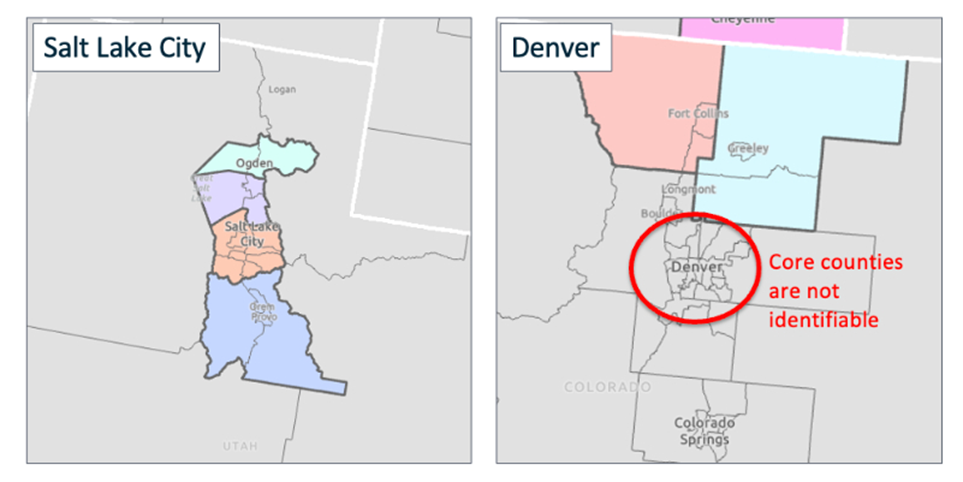
PUMAs don’t always line up with familiar boundaries. This is perhaps the biggest headache for practical policy work. In some metro areas like Salt Lake City, PUMAs align reasonably well with county boundaries. In others, like Denver, the core counties aren’t identifiable at all because they’re split across multiple PUMAs or combined with surrounding areas. For Virginia localities trying to use PUMS data for needs assessments or grant applications, this mismatch can mean you can’t isolate your specific jurisdiction
PUMAs keep changing. The Census Bureau redraws PUMA boundaries every ten years based on population shifts. This helps better reflect reality, but it makes tracking trends over time more complicated. For example, the PUMA drawn in 2010 that covered most of the lower-population counties in the PlanRVA region was broken into two after 2020, due to significant population growth. Of course, that meant splitting Hanover County in half right along Route 301.

Bridging Rural and Urban: New Tools for Better Analysis
The good news is that researchers have developed supplemental tools to help us work around PUMA limitations. IPUMS USA has added geographic indicators that can help distinguish urban and rural populations even when we can’t identify specific small towns:
Population density measures tell us how concentrated the population is within a PUMA—helping distinguish truly rural areas from suburban or urban ones, even if we can’t identify the specific locality.
Metropolitan population variables indicate what size commuting system a PUMA is part of, capturing whether residents live in areas connected to large metro economies or more isolated communities.
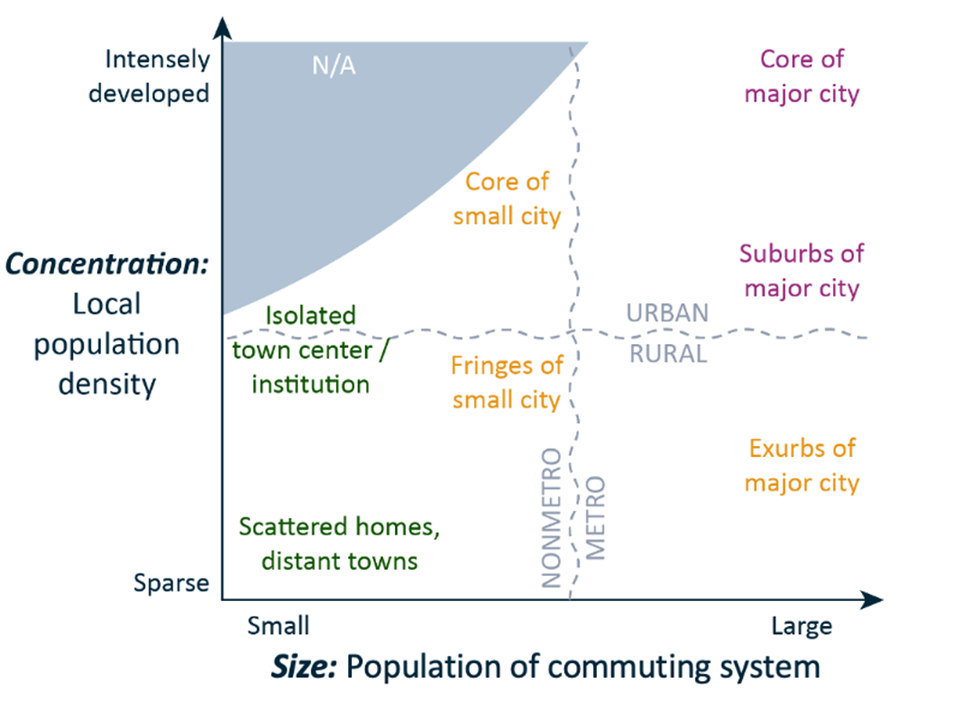
These two dimensions—concentration and size—give us a more nuanced way to think about the rural-urban spectrum beyond simple binary categories.
Why This Matters for Virginia Housing Policy
Let’s say you’re working on a housing needs assessment for a Virginia locality. Summary tables might tell you that 30% of renters are cost-burdened. But PUMS data can reveal which cost-burdened renters are most vulnerable—breaking down by household composition, employment type, commute patterns, and more.
For rural housing advocates, PUMS can illuminate how challenges differ from urban areas even without identifying specific small towns. You can analyze whether rural households (defined by low density and smaller metro areas) are more likely to face both housing cost burdens and transportation cost burdens, or how rural homeowners’ characteristics differ from urban homeowners when it comes to home age, value, and maintenance needs.
For urban planners, PUMS can answer questions about specific populations that summary data glosses over—like how housing stability differs for service workers versus remote workers, or how housing tenure relates to household formation patterns among young adults.
The spatial limitations of PUMAs mean this analysis works better for some places than others. If you’re in a Virginia metro area where PUMA boundaries roughly align with your jurisdiction, you’re in luck. If not, you might need to work at a broader regional scale or focus on characteristics-based analysis rather than place-based analysis.
The Bottom Line
Virginia’s housing challenges don’t fit neatly into urban or rural boxes, and our tools for understanding them don’t fit neatly into jurisdictional boundaries either. PUMAs weren’t designed for housing policy analysis—they were designed to protect privacy while enabling research. That means working with PUMS data requires both creativity and humility about what the geography can and can’t tell us. Even with its limitations, PUMS data remains one of our best tools for telling more complete stories about who needs housing support and why.
Want to learn more? Check out the IPUMS USA webinar “Beyond the PUMA: Supplemental Geography in ACS Microdata” which walks through practical applications of these concepts and helps demystify the geographic complexities.
Additional Resources:
- IPUMS USA: https://usa.ipums.org
- Census Bureau PUMS Documentation
- IPUMS geographic resources: boundary files, crosswalks, and match summaries
- Contact us to discuss how PUMS data might support your housing research