
Image source: Wikipedia Commons
FWD #254 • 1,272 words
What the 1970s can teach us about inflation, housing policy, and what might come next.
Almost three years ago, economist Larry Summers posted a chart overlaying 1970s CPI data onto the post-2013 trajectory as a warning against declaring victory against inflation too soon. Misleading axes led critics to call it a “chart crime” — perhaps the mildest controversy of Summers’ career. Common wisdom at the time also could not imagine any geopolitical calamity that might send prices skyrocketing like the 1979 oil shock did.
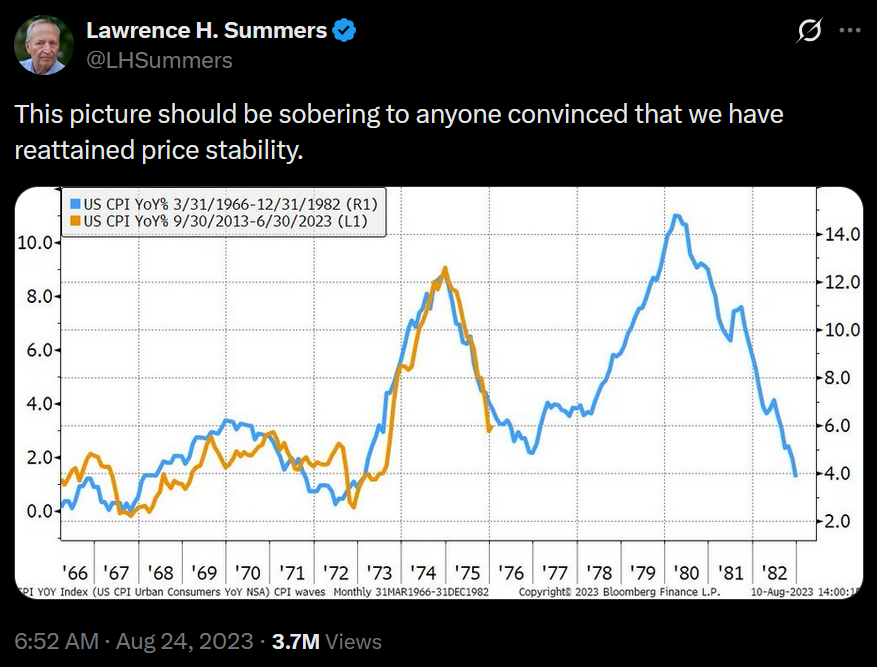
My, how things change. US and Israeli forces began strikes against Iran in late February, and oil markets responded immediately. Brent crude surged past $100 a barrel. Inflation expectations, already elevated from years of tariff pressure and sticky core prices, spiked again. Suddenly, that chart looks more prescient than criminal.
For housing practitioners, our instinct might just be to track mortgage rates, hold tight, and hope it all works out. But the current moment invites a different kind of reflection. Let’s wind back 50 years, indulge our nostalgia, and find some important lessons worth considering today.
The 1970s, Briefly
The inflation of the disco era didn’t arrive all at once. A first wave, driven by the 1973 Arab oil embargo and Nixon’s removal of the dollar from the gold standard, pushed CPI to around 12% in 1974. Then it subsided. By 1976 and 1977, most everyone thought the worst was behind them.
They were wrong. A second wave — touched off by the Iranian Revolution, loose fiscal policy, and accumulated wage pressure — reignited inflation and pushed CPI to roughly 14% by 1980.
Federal Reserve Chair Paul Volcker responded with an aggressive tightening campaign. The federal funds rate exceeded 20% by 1981. The 30-year fixed mortgage rate peaked at 18.4% in October of that year.
The collateral damage was severe. The savings and loan industry, built on a fundamental mismatch between short-term deposits and long-term fixed-rate mortgages, couldn’t survive the rate spike. In 1980, nearly 4,000 thrifts held $600 billion in assets, most of it in mortgage loans. Policymakers responded by loosening restrictions — allowing S&Ls to make riskier bets to earn their way out of insolvency.
It didn’t work. Over the next decade, the S&L crisis ultimately cost taxpayers roughly $130 billion and wiped out hundreds of institutions.
What the Inflation Era Destroyed — and What It Built
Before the inflationary spiral hit, federal housing policy was doing something it hasn’t done since: producing homes at scale. Through Section 236 subsidized construction loans, FHA-insured financing, and Ginnie Mae securitization, the federal government helped produce millions of new multifamily units during the “HUD boom” of 1968–1973.
Nixon’s 1973 moratorium on subsidized housing approvals ended that era abruptly. Later on, the Volcker shock finished off the institutional infrastructure that remained.
The next era of federal housing policy began when the Housing and Community Development Act of 1974 created Section 8. Affordability, not physical housing conditions, was now the central problem. The original Section 8 included a New Construction component that produced about 1 million units until 1983, when Reagan phased it out. Additional changes that year, along with subsequent updates in 1987 and 1998, led the Housing Choice Voucher program to become the sole remaining component with widespread impacts.
The Low-Income Housing Tax Credit, created in 1986, emerged from the wreckage of the S&L era — an attempt to rebuild affordable housing production through private capital markets after thrift-based housing finance had effectively collapsed. It remains the primary federal production tool today, nearly 40 years later.
As federal housing strategy shifted to demand-side subsidies and tax credits, new apartment construction tanked. Raising the Housing Investment Level, a new report released this week by the Center for Public Enterprise puts it plainly:
“The only times in modern American history we’ve achieved anything close to [closing the housing gap] were periods when coordinated federal policy made apartment construction unusually attractive for investment. For the past 40 years, we’ve had no such policy. And for 40 years, multifamily production has flatlined.”
Why the Parallel Matters Now
Today’s inflationary pressures share a recognizable structure with the 1970s second wave. Beyond the immediate and downstream effects of higher oil prices, the federal deficit is now projected to exceed 7% of GDP this year. Immigration enforcement is tightening labor supply in construction and other migrant-dependent sectors, with some costs already rising at a 10% annual rate. And the Fed, after a year of confident messaging, is now openly acknowledging uncertainty about whether tariff-driven inflation is “one-time.”
For affordable housing development, the dynamics are particularly difficult. High financing costs make construction debt expensive — the same mechanism that froze housing activity in 1981. At the same time, tariffs on softwood, aluminum, gypsum, and other commonly imported materials have driven up construction costs from the other direction.
The result is visible in the data. CPE estimates 750,000 multifamily units in the US that are entitled but not yet permitted. The projects exist. The financing doesn’t work.
On the policy side, federal legislation has expanded 9% LIHTC allocations and eased the private-activity bond test for 4% transactions. These are meaningful changes, potentially the most consequential to affordable housing finance in years. Whether they can offset elevated costs and constrained capital remains an open question.
Three Scenarios to Watch
What happens next depends on decisions being made now in Washington, financial markets, and geopolitics. That doesn’t inspire much confidence, but we can at least imagine a few distinct paths.
Best case: In the most favorable scenario, tariff effects prove genuinely transitory — a one-time price adjustment rather than a sustained inflationary driver. The Iran conflict de-escalates, oil prices retreat, and the Fed threads the needle. Mortgage rates ease modestly, some of the shadow pipeline unlocks, and the housing market stabilizes.
Not great, not terrible: A second scenario involves a prolonged period of elevated rates, even without a dramatic second spike. The Fed holds rates higher for longer to prevent inflation from re-accelerating. Construction lending stays tight. The lag between pipeline and production stretches out. LIHTC transactions remain difficult to underwrite. Affordable production continues, but there’s no net gain in the right direction.
Worst case: The third scenario is the one economists most fear: stagflation. Inflation persists even as economic growth slows. Unemployment rises. Vouchers lose purchasing power as rents outpace Fair Market Rent adjustments. Developers can’t make projects pencil. The shadow pipeline doesn’t just stall — it shrinks as entitlements lapse and developers walk away.
Things to Keep an Eye On
Most affordable housing practitioners watch LIHTC equity pricing, HUD budget proposals, and multifamily permit data. Those remain important. But the current moment calls for paying attention to a few indicators that don’t usually show up in our browser tabs.
Fed communications. When the Fed signals uncertainty about whether inflation is transitory — as Powell has done in recent weeks — it’s a meaningful shift. The difference between “one more hike” and “higher for longer” reshapes development feasibility across the entire pipeline.
Inflation breakeven rates. Market-implied inflation expectations, particularly the 1-year breakeven rate, reflect what bond markets actually expect — not what policymakers say.
Global oil supply. Brent crude prices and OPEC production decisions are leading indicators for the inflationary environment that determines construction lending conditions six to twelve months later.
Tariff developments and trade negotiations. Construction material costs are directly sensitive to tariff policy. Yale’s Budget Lab tracks effective tariff rates and pass-through estimates on a rolling basis — a useful resource for anticipating cost pressure before it shows up in hard cost budgets.
The 1970s didn’t catch housing policy off guard because the signals weren’t there. They were. The gap was between what the signals implied and what practitioners and policymakers were prepared to do with them. That’s the real lesson worth carrying forward.