
The FWD #207 • 697 Words
Housing starts decline, income and credit disparities increase, and cost burden hits harder
If you happened to catch NPR’s explainer on housing affordability earlier in the week, you heard Alex Horowitz, director of Pew Charitable Trust’s Housing Policy Initiative share some sobering statistics on home prices, rents, and cost burden across America. Those nationwide figures make sense for a national broadcast, but you might’ve been left wondering what the numbers actually look like closer to home.
That’s why we made Sourcebook.
Sourcebook is our free compendium of data visualizations that help contextualize housing needs across the Commonwealth. With Sourcebook, you can drill down on important data questions at the state, regional, and local levels.
We recently updated Sourcebook with the latest data from the U.S Census Bureau, the U.S. Department of Housing and Urban Development, the Virginia REALTORS®, the National Housing Preservation Database (NHPD), and the Home Mortgage Disclosure Act (HMDA). So, what does this new data tell us about housing needs in Virginia? Let’s take a look at some key trends we’re seeing.
The COVID-era housing boom is over
Both 2021 and 2022 saw nearly 40,000 building permits issued in Virginia, a number not seen since before the Great Recession. While Virginia had been steadily climbing back from the Great Recession since 2010, there was a major uptick between 2020 and 2021 that could be attributed to pandemic-driven demand as homes became offices too.
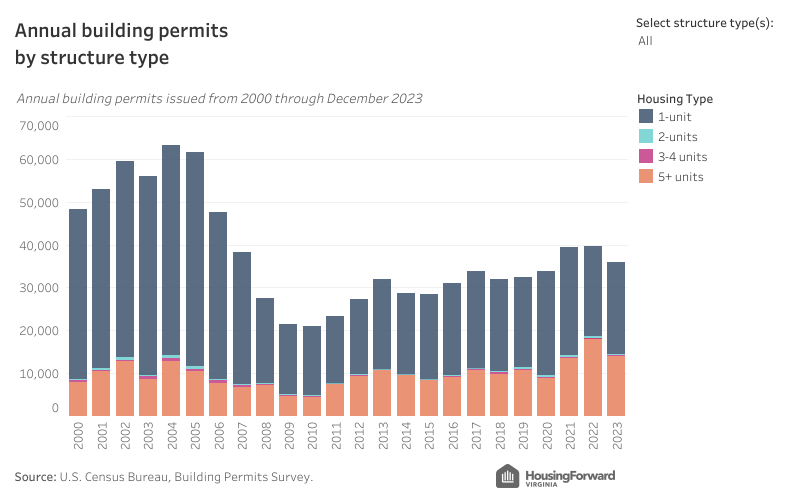
But from 2022 to 2023, construction starts decreased by about 3,000. Most of that cooling occurred among multifamily housing and can be attributed to increasingly tight lending conditions, high cost development loans, and a shortage of skilled workers.
Racial income disparity has widened
The most recent data from the U.S. Census Bureau estimates that white, non-Hispanic households in Virginia make $93,942 per year on average. This figure is nearly $34,000 more than the typical Black household in Virginia. In 2020, this racial income gap was just $29,321 and in 2010 it was only $24,187.
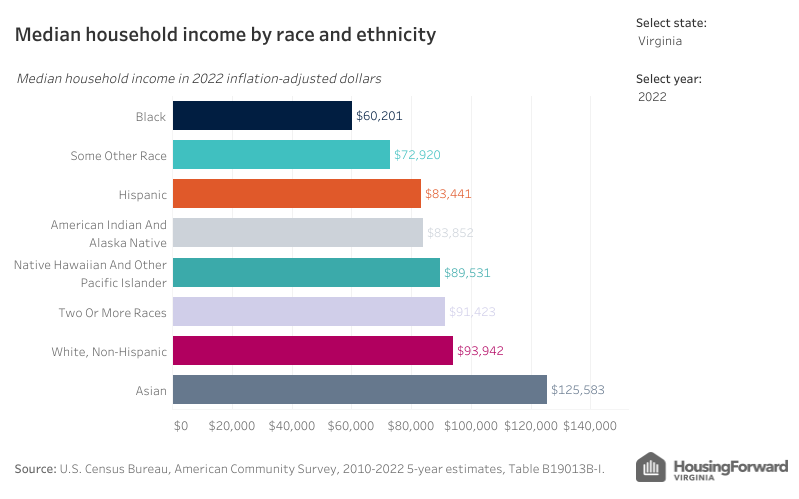
The related racial wealth gap has major implications on the housing market. Homeownership continues to be a major pathway for individual households to accumulate wealth, especially for BIPOC households. But with lower median household incomes amid only increasing home prices, Black households continue to be locked out of the homeownership market and the wealth it can bring.
Disproportionate home mortgage denial continues
Mortgage loan denial rates for BIPOC households in Virginia still outpace denial rates for their white counterparts. The latest data from the Home Mortgage Disclosure Act shows that in 2022, 16% of loan applications submitted by Black homebuyers were denied—double that of white households.
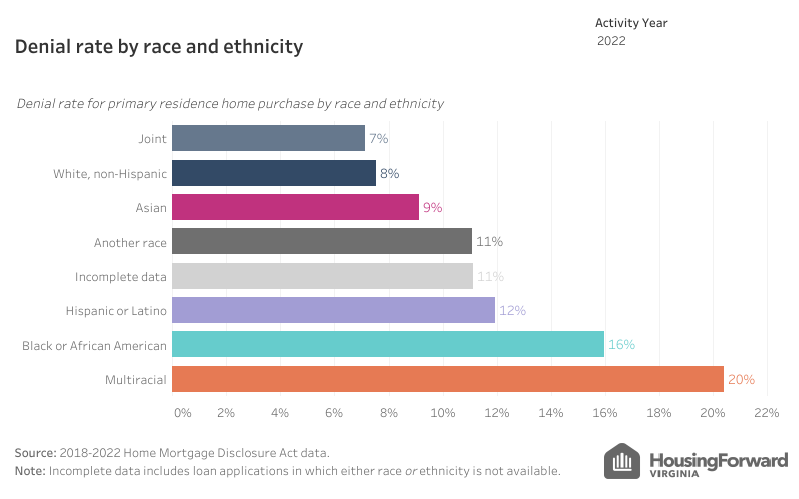
While debt-to-income ratios are usually the main cause for denial, research from the National Association of REALTORS shows that credit scores are more often the reason for denial among Black applicants.Credit scores have increasingly been criticized for perpetuating racial disparities.
Housing cost burden hits renters under 50% AMI the hardest
The most recent Comprehensive Housing Affordability Strategy dataset shows that in 2020, nearly 83% of renter households making less than 30% of their Area Median Income were housing cost burdened. The vast majority of those cost-burdened households (85%) were paying more than half of their income towards housing costs.
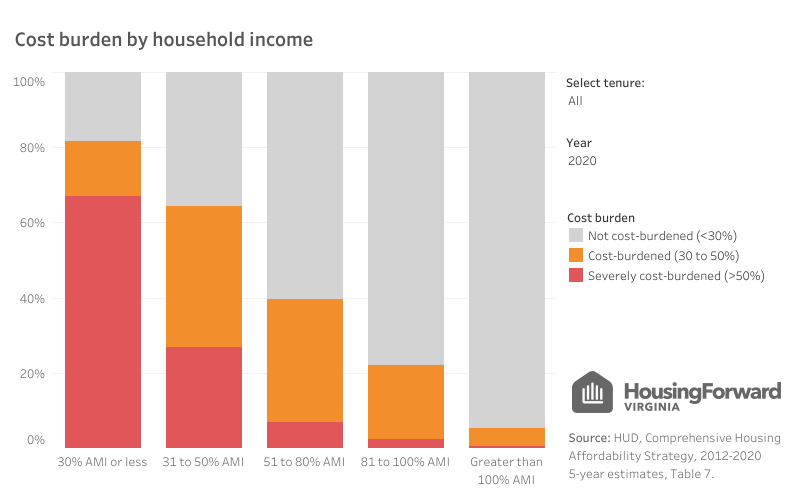
Seventy-eight percent of renter households making between 31% and 50% of AMI were cost burdened, while less than half of households over 50% of AMI were cost burdened.
We’re just scratching the surface of housing trends across Virginia. There’s a lot more nuance throughout the Commonwealth when you look at these indicators at the regional or local levels.
Spend a few minutes during your morning coffee thumbing through the filters of Sourcebook dashboards! Let us know what you’re seeing, or tell us about a dashboard that you want to see developed in the future.
Are you using Sourcebook to advance your work in housing? We want to hear from you!
If you’ve used data from Sourcebook to help get the word out about affordable housing, whether you’re a policy advocate, a developer, or just a passionate citizen, send us a message. Stories like yours are essential in demonstrating Sourcebook’s impact to our supporters.