
The FWD #193 • 807 Words
How to explain economic recessions and recovery to the average American: use kitchen implements.
Believe it or not, there are people more obsessed with charts than us housing researchers. Those people are called economists. Sometimes, as you’ll find out today, they stare at charts long enough to hallucinate various inanimate objects. Do these apparitions help us understand complex economic trends? In this case, they might actually be onto something.
Meet the Frying Pan Chart
Alex Williams, an economist at Employ America, first gave us the Frying Pan to illustrate our country’s economic journey over the past two decades.
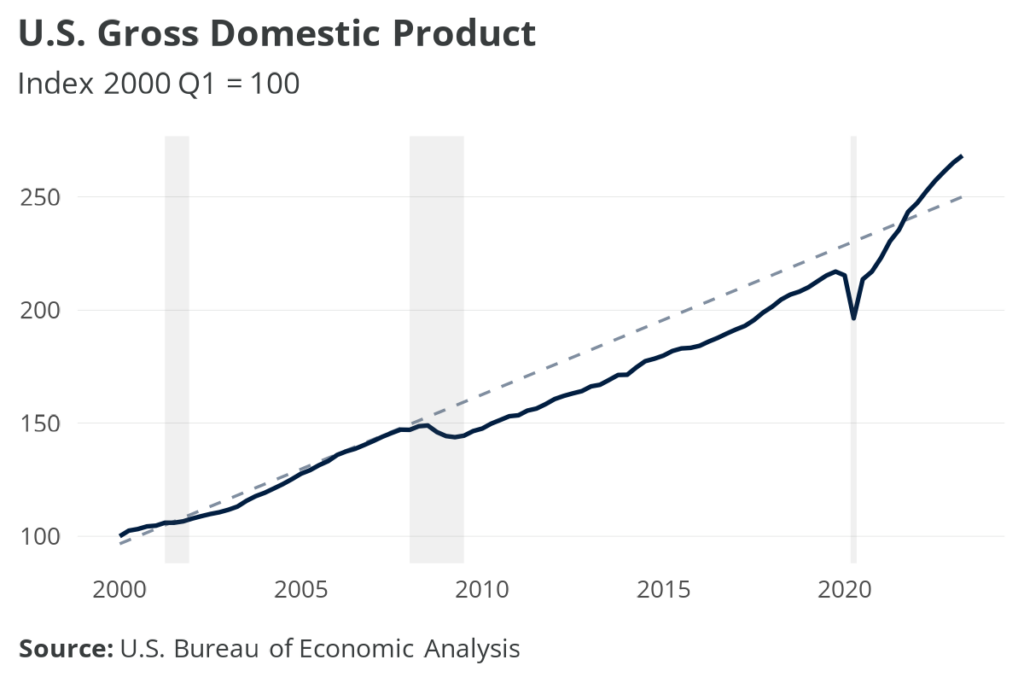
Let’s start by looking at national GDP since 2000. Steady growth through 2007 forms the pan’s handle, while the subsequent crash leads us into the base. Economic activity never fully recovered for more than a decade after, until the turbocharged post-COVID stimulus led us away from a major depression and back over the lip of the pan.
Economists quickly scoured the FRED cupboards for more Frying Pans and quickly realized how succinctly the metaphor contrasts the recovery periods following the 2008 financial crisis and the COVID-19 pandemic. Here’s consumer spending, broken down by durable goods versus services.
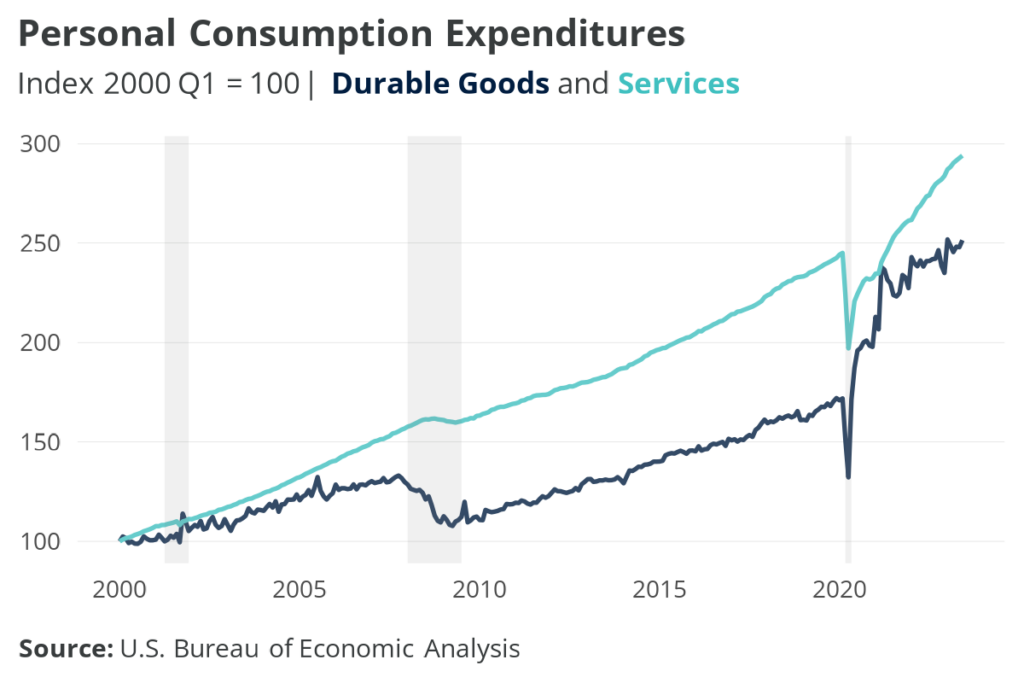
After the 2008 recession, Americans tightened their belts and significantly reduced discretionary spending on appliances, cars, and furniture. However, they continued to pay for services at almost the same level, primarily on housing and healthcare.
Then, in the summer of 2020, rock-bottom interest rates and stimulus checks sent Americans shopping for big purchases again. That surge gives us quite a deep pan. Spending on services also significantly rebounded once the first phase of COVID lockdowns ended, creating what instead looks like a nice crepe pan.
Lost in the saucepan
Paul Krugman recently offered his take on how we found ourselves in the Frying Pan in the first place, focusing on how the initial stimulus packages in 2008 and 2009 were enough to avoid depression, but ultimately inadequate to overcome the shock. Capitalizing on these failures, a stubborn austerity movement quickly found root in D.C, shutting out any hope for additional relief. (Remember the Tea Party?)
The “lost decade” that followed was, oddly enough, brought to an end by a global pandemic. When COVID halted nearly all economic activity in March 2020, the historic relief packages passed by Congress over the next year—the CARES Act and American Rescue Plan—totaled over $4 trillion.
Along with being much larger than their post-2008 counterparts, these investments notably featured simple and substantial direct assistance to Americans. Unconditional stimulus payments, boosted unemployment benefits, rent and mortgage relief, the Paycheck Protection Program, and many other interventions all helped us get out of the pan.
Once you see it, you can’t unsee it
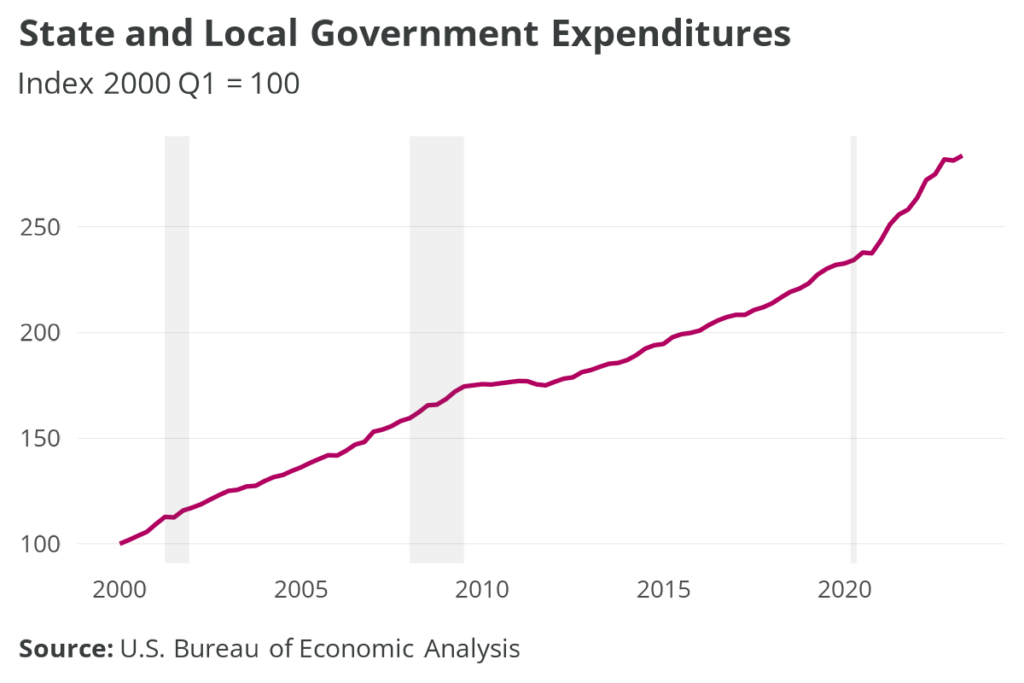
Here’s the Frying Pan showing one immediate policymaking consequence of the first underwhelming stimulus: deflated state and local government spending. The stunted recovery meant lower revenues, which led to a downturn in funding for transportation, schools, and other critical pieces of social infrastructure supported by state and local governments.
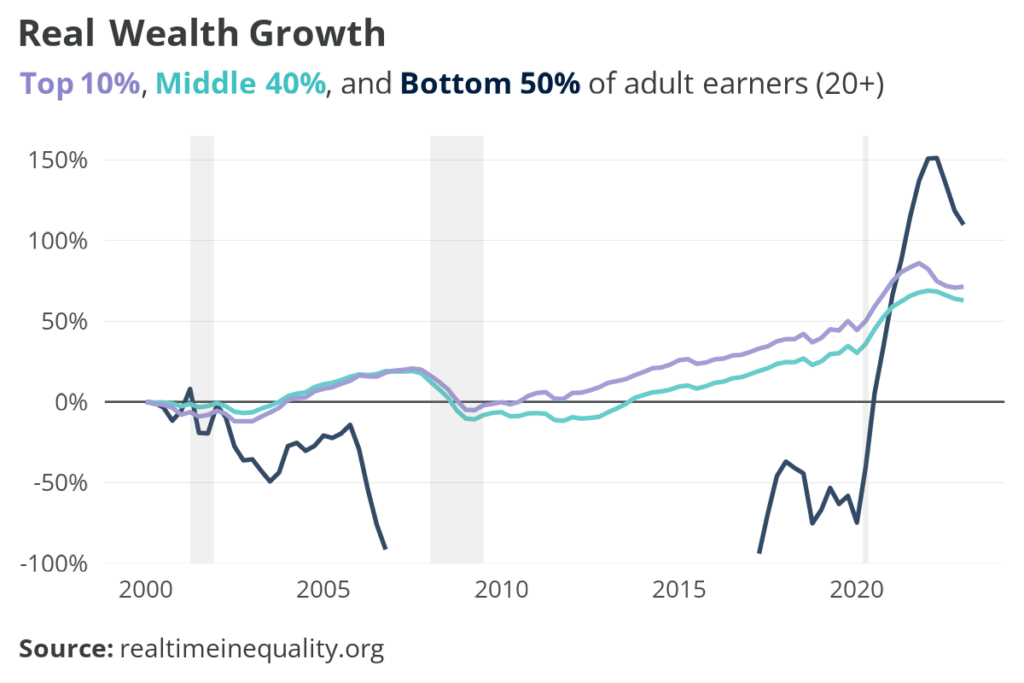
The pan also maps onto the trajectory of wealth inequality since 2000. Both the top 10% and middle 40% of earners took hits in 2008, but have now increased their wealth back to levels expected if there was no downturn at all.
Losses for the lower half of earners are literally off the chart—bottoming out at almost -400% in mid-2009—before making major gains during the COVID recovery. Unfortunately, the average wealth for this group is still less than $10,000.
Housing’s flash in the pan
Because the housing market played such an integral role in the financial crisis, many housing indicators have much more severe ups and downs. Here, the Frying Pan begins to sizzle away in favor of more exotic kitchen implements.
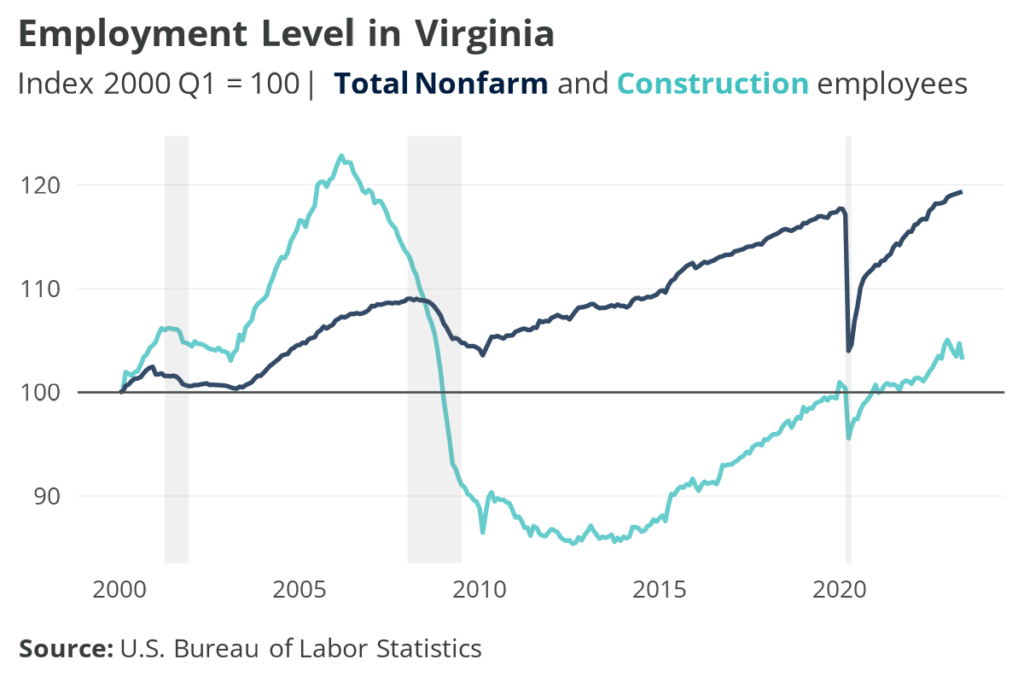
In line with the national decline in residential construction spending, the Great Recession hit Virginia’s homebuilding industry hard. Although our overall employment level enjoyed better-than-average growth after 2008, and already rebounded past pre-pandemic levels, the number of construction workers has just barely returned from the deep-bottomed wok of 2010 to 2015.
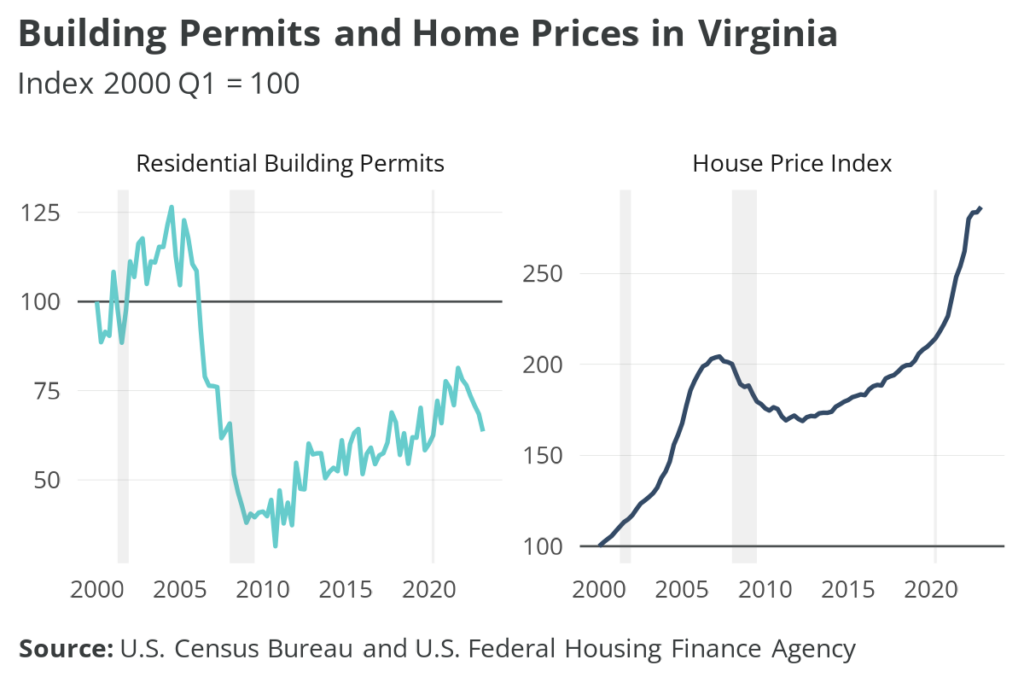
Once the residential construction engine turned off, building permits across the state tanked, and are still only around two-thirds what they were in 2000. (Let’s call this one an offset icing spatula.) Home prices, as we know, also came down after the crash but steadily climbed back. They then accelerated rapidly right before and during COVID, giving us a smooth saucepan.
Do Frying Pans tell us anything we didn’t already know? Probably not. Are we oversimplifying simultaneous complex trends? Probably.
Still, we think there’s value in metaphors like this. Regular folks (i.e., those who are lucky enough to not stare at charts all day) can more easily weave a sensible narrative connecting policy decisions with real-world outcomes. At the very least, if they’re curious to learn more, then it all pans out.